If you are impacted by the Federal government transition, we’re here for you. Virginia Works, the Commonwealth’s workforce development agency, is committed to helping every Virginian navigate career transitions and find the best job for them.
Consider Applying for a State Job
Virginia State Government Career Opportunities: Virginia state government currently has over 4,500 available career opportunities in a broad variety of fields, with locations statewide. Visit https://www.jobs.virginia.gov/ to search for a mission-focused opportunity that works for you.
Sign up for information about upcoming virtual job fairs and other events
Please complete this survey to receive information about upcoming hiring events and access additional resources to support you.
Apply for unemployment & other benefits
Virginia Works’ partner agency, the Virginia Employment Commission, has a variety of tools to make it easier to apply for unemployment insurance. To learn about unemployment resources for former federal workers, visit this page. Before you begin, review the benefits eligibility requirements and step-by-step application video on VEC’s website at www.vec.virginia.gov. Have your driver’s license or government-issued ID handy. For assistance, you may also call VEC’s Customer Contact Center at 1-866-832-2363.
Individuals who experience a change in life circumstance outside of Open Enrollment may be eligible for a 60-day Special Enrollment Period to apply for health insurance through Virginia’s Insurance Marketplace, as well as financial assistance. For more information, visit www.EnrollVA.org.
Virginia Works provides access to a suite of tools and resources to support every jobseeker’s career navigation and job search needs. The Job Seekers’ Toolkit at https://www.virginiaworks.gov/job-seekers/ includes a wealth of labor market information, interview tips and tricks, and a career resource guide.
In Person Support: You can receive free job search support, resume and cover letter review, and interview prep – as well as accessing training support and other educational opportunities for those who qualify – by visiting any of dozens of locally-administered Virginia Career Works center across the Commonwealth. You can find the location closest to you by visiting www.careeronestop.org/LocalHelp/AmericanJobCenters/find-american-job-centers.aspx
Upskilling and Reskilling: The Virginia Community College System (VCCS) offers a variety of credentials along with programs that you may be eligible for that can provide financial assistance, like G3, FastForward, and more. Visit vccs.edu for more information and tools to help determine whether these programs may be right for you.
Update your resume
If you are a former Federal employee looking to transition to the private sector, you may want to consider updating your resume to translate your detailed government job duties and accomplishments into industry terminology, avoiding overly technical jargon or acronyms. action-oriented statements that highlight relevant skills and achievements, using common industry terminology, and generally shortening the length to fit a standard 1-2 page resume format while still emphasizing key qualifications for the desired civilian role.
Key points to consider when revising your resume from Federal employment:
Simplify Language: Replace government-specific terms with their private sector equivalents. For example, “program manager” instead of “project officer,” “stakeholder engagement” instead of “interagency coordination.” Remove federal job series, grades (e.g., GS-13), and excessive detail about every duty. Avoid excessive acronyms (or spell them out and explain briefly).
Focus on Results: Quantify your achievements with numbers and percentages to demonstrate the impact of your work. Focus on achievements and impact rather than task descriptions. Use quantifiable metrics where possible: Instead of “Reviewed policy documents,” say “Streamlined policy review process, reducing approval time by 30%.” Use action verbs like “optimized,” “implemented,” “increased,” “developed,” “led,” etc.
Streamline the Format: Federal resumes are often lengthy (4–6 pages). Aim for 1–2 pages for the private sector. Use a clean, modern layout with bullet points for readability. Ensure your resume is free from errors and presents a professional image. You can select a standard resume format that’s either a chronological or functional format depending on your career goals.
Tailor to Each Job: Start by analyzing each job posting to identify the key skills and qualifications they are seeking. Customize your resume for each position by highlighting the most relevant skills and experiences listed in the job description. Highlight experience in improving processes, cost savings, increasing efficiency, or driving innovation.
Adjust the Summary/Profile Section: Government resumes often start with a long “Professional Summary” or “Objective.” Condense it into a 3–5 sentence professional summary highlighting your most relevant skills and industry experience.
Condense Details: While federal resumes often require extensive detail, private sector resumes can be more concise, focusing on key accomplishments and responsibilities.
Remove Unnecessary Information: Eliminate details like agency-specific acronyms, occupational series numbers, and overly technical jargon that may not be familiar to private sector hiring managers.
Example of translating federal government experience to non-government terms:
Federal Role: “Managed a team of analysts responsible for developing and implementing budget proposals for a large federal agency.”
The “Transferrable Skill”: “Led a team of financial analysts in crafting and executing strategic budget plans, resulting in $X million in cost savings.”
Federal Role: “Managed interagency coordination for compliance with federal mandates.”
The “Transferrable Skill”: “Led cross-functional teams to ensure regulatory compliance.”
Use keywords from the job posting to ensure your resume gets past automated screening systems, optimizing for industry terms. In general, highlighting the following areas is key for resumes in the private sector or non-government employment:
Technical Skills: Specific software proficiency, data analysis skills, project management tools.
Communication Skills: Effective written and verbal communication, stakeholder engagement.
Access mental health resources to support how you manage this change
Virtual/online or via phone:
Dial 988: Call or text (988), or chat (988VA.org), 24/7/365 for immediate mental health, substance use, or emotional support for you or someone else.
Crisis Line: Veterans can access free, 24/7 support by calling 988, then pressing 1, texting 838255, or chatting (VeteransCrisisLine.net) — no VA benefits required.
Dial 211: Connect to resources (211Virginia.org) for food, shelter, health, jobs, and more.
Accessing additional support tailored to Veterans’ needs
We understand that a large number of the Federal workforce are veterans. Thank you for your service! Virginia Works has Veteran Employment Specialists to guide and connect you to the appropriate employment resources both within the Commonwealth and your local community. Email us directly at Veteran.Services@virginiaworks.gov.
Virginia Veterans Network (VVN)
The Virginia Veterans Network (VVN) is a free online hub of resources and services for veterans, service members, and their families. The network provides direct access to resources and services – covering everything from job training and employment to health care and wellness – from trusted veterans service organizations, nonprofits, and state agencies. Click here for more information.
Virginia Department for Aging and Rehabilitative Services (DARS)
If you are a Virginian with a disability, the Virginia Department for Aging and Rehabilitative Services (DARS) can connect you to meaningful careers and job training programs in high-demand, high-growth industries. Working with a vocational rehabilitation counselor, DARS can help you set and achieve career goals and pursue training, apprenticeships, certifications, or credentials tailored to your needs. Get started with our Pathways to Careers program or learn more about Vocational Rehabilitation through DARS.
RICHMOND, VA – Virginia employers in high-demand industries seeking highly trained workers had a significant opportunity to grow their workforce through the Virginia Works HIRED Fund. This initiative provided eligible employers the chance to apply for up to $6,000 per apprentice to support the training and development of their workforce through registered apprenticeship programs.
Registered apprenticeship is thought of as the “ultimate earn while you learn opportunity” for individuals looking to gain valuable skills while earning a progressive wage. For employers, it is a proven, cost-effective, and industry-focused approach to cultivating a highly skilled and dedicated workforce tailored to their specific needs.
This funding aimed to further expand apprenticeship opportunities across the Commonwealth and empower businesses to build robust talent pipelines. The HIRED Grant has demonstrated its impact with 28 Sponsor awardees successfully onboarding 47 new apprentices.
Employers in high-demand sectors were encouraged to take advantage of this valuable funding opportunity to train the skilled workers they needed for success. Stay tuned for additional funding windows in the future!
RICHMOND, VA – Virginia Works, Virginia Career Works, and the Virginia Employment Commission are pleased to announce a dynamic virtual event designed to connect jobseekers with Registered Apprenticeship Sponsors in the Commonwealth of Virginia. The inaugural Registered Apprenticeship Expo will take place on April 30th from 10 am to 2 pm.
This initiative offers a valuable opportunity for employers to engage with prospective apprentices and highlight the benefits of Registered Apprenticeship as a proven strategy for workforce development. Participating sponsors will have the ability to staff a virtual “booth,” chat and conduct 1:1 video interviews with job seekers, deliver webinar-style presentations about their organizations, and directly follow up with interested candidates through their tracking systems.
Prior to the big day, sponsors will need to create job postings for their booth, select relevant categories for their booth in the virtual lobby, review registered jobseeker attendees, and set their availability for scheduled video meetings. Sponsors can also personalize their virtual booth so potential apprentices can more easily identify logos and branding.
Virginia Works is committed to supporting structured training and industry needs in the Commonwealth. Register here today! If you have any other questions, please email Hiring.Events@virginiaworks.gov.
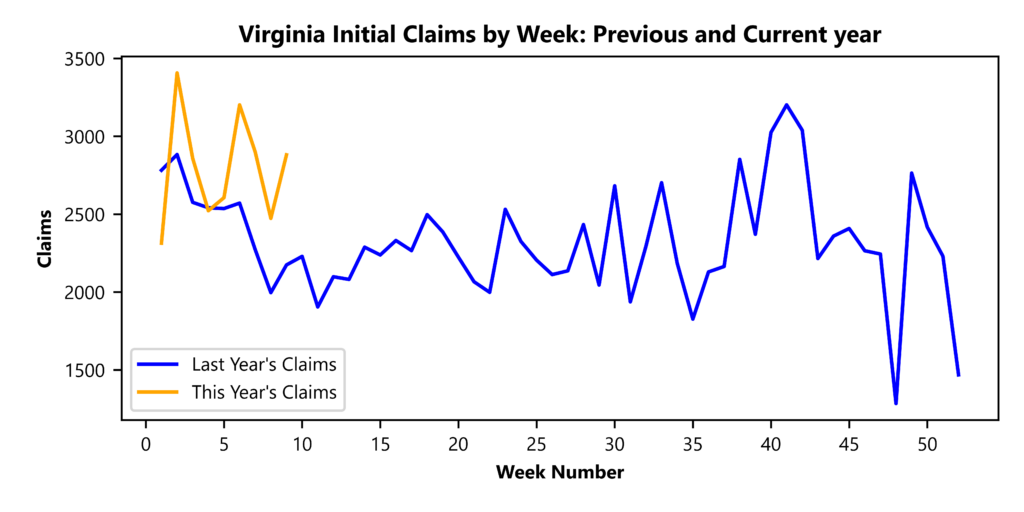
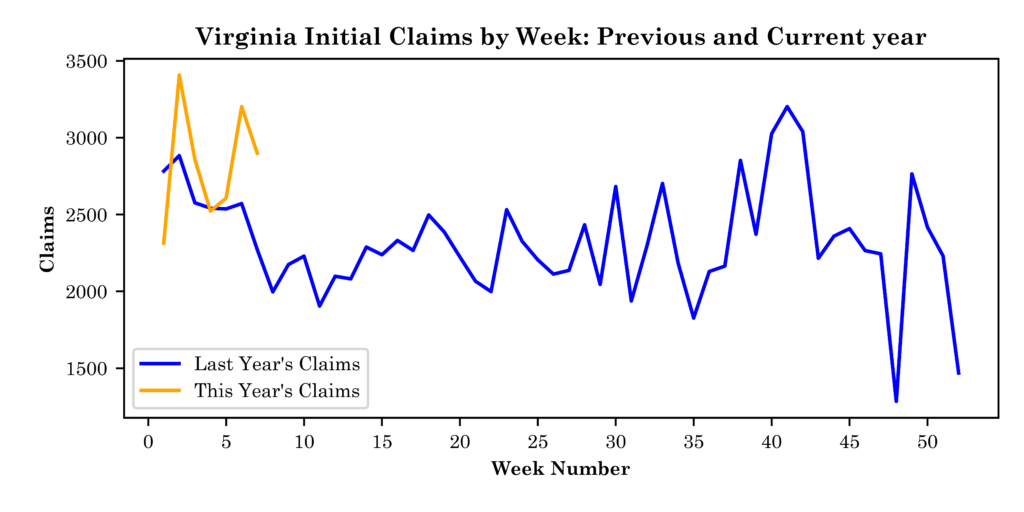
RICHMOND — Virginia Works announced today that 2,881 unemployment insurance weekly initialclaims were filed during the week ending March 01, 2025, which is 16.5 percent higher than last week’s 2,473 claims and 32.5 percent higher than the comparable week of last year (2,174). Nearly 72 percent of claimants self-reported an associated industry; of those reported, the top five industries (60 percent) were Professional, Scientific, and Technical Services (390); Administrative and Support and Waste Management (218); Retail Trade (217); Health Care and Social Assistance (176); and Manufacturing (162).
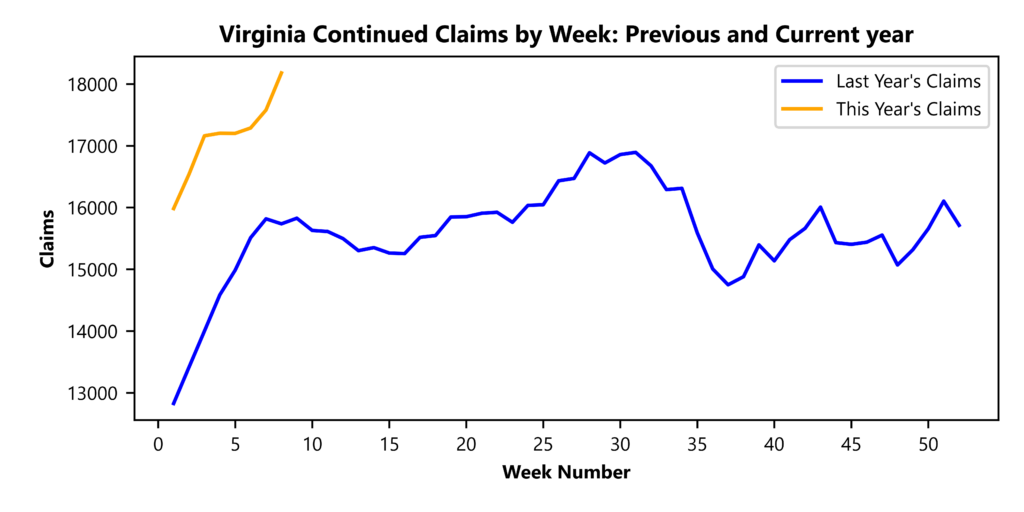
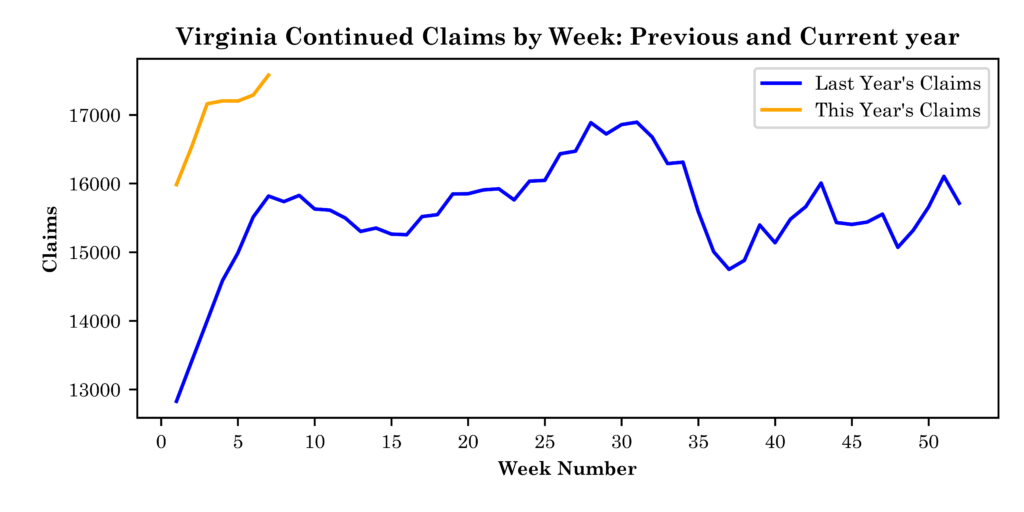
Continued weeks claims (17,671) were 2.8 percent lower than last week (18,179) and were 11.7 percent higher than the comparable week of last year (15,827). Nearly 92 percent of claimants self-reported an associated industry; of those reported, the top five industries (58 percent) were Professional, Scientific, and Technical Services (2,822); Administrative and Support and Waste Management (2,138); Construction (1,576); Health Care and Social Assistance (1,523); and Manufacturing (1,354).
Significant Layoffs and Announcements are available at the following websites:
Initial Claims – Comparison of Unemployment Insurance Activity
Week Ending03/01/2025
Week Ending02/22/2025
Week Ending02/15/2025
Last Year03/02/2024
Initial Claims
2,881
2,473
2,899
2,174
Initial Change (%)
+408 (+16.5%)
-426 (-14.7%)
-303 (-9.5%)
+707 (+32.5%)
Continued Claims
17,671
18,179
17,579
15,827
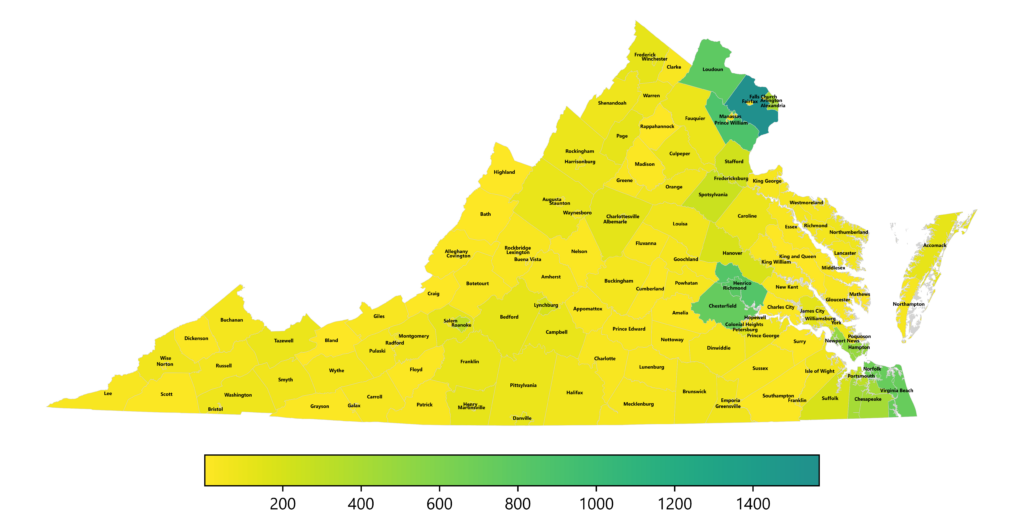
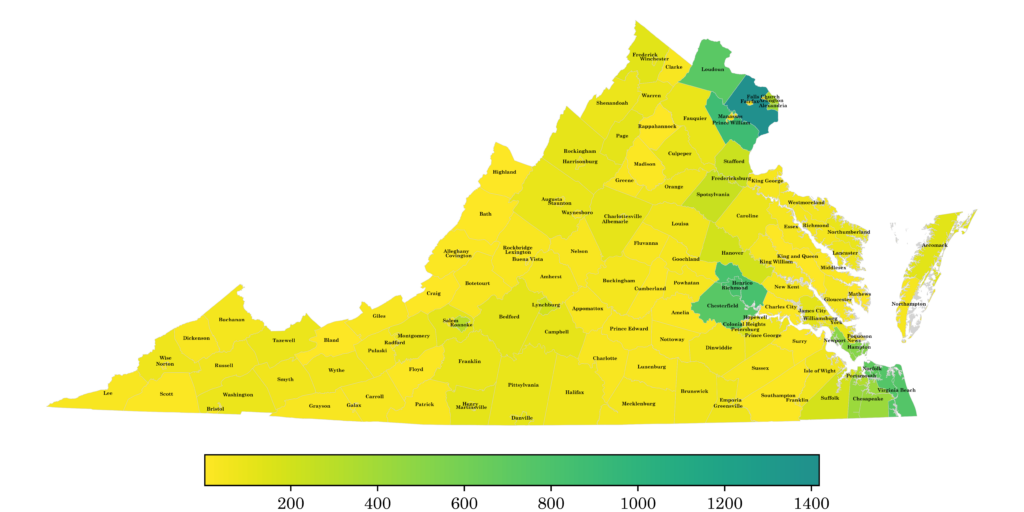
Virginia Continued Weeks Claimed
A person who has already filed an initial claim and who has experienced a week of unemployment files a continued claim to claim benefits for that week of unemployment. On a weekly basis, continued claims reflect a good approximation of the current number of insured unemployed workers filing for UI benefits, and are a good indicator of labor market conditions. While continued claims are not a leading indicator, they provide confirming evidence of the direction of the economy.
The color-coded map below shows the distribution of this week’s continued claims for Virginia’s counties and cities.
Yellow represents low numbers, while progressively darker shades transitioning from yellow to green and dark green signify increasing numbers of continued claims. The legend located at the bottom provides the color spectrum and its corresponding count of continued claims.
Initial Claims for All States
In the week ending March 1, the advance figure for seasonally adjusted initial claims was 221,000, a decrease of 21,000 from the previous week’s unrevised level of 242,000. The advance number of actual initial claims under state programs, unadjusted, totaled 224,689 in the week ending March 1, an increase of 3,833 (or 1.7 percent) from the previous week. The seasonal factors had expected an increase of 25,158 (or 11.4 percent) from the previous week. There were 214,424 initial claims in the comparable week in 2024.
Initial State Claims (5 largest decreases) (Not Seasonally Adjusted)
State
Initial Claims (this week)
Initial Claims (prior week)
Change
Massachusetts
5,267
9,256
-3,989
Rhode Island
987
2,990
-2,003
Michigan
5,627
7,559
-1,932
Illinois
10,057
11,066
-1,009
New Jersey
8,832
9,761
-929
Initial State Claims (5 largest increases) (Not Seasonally Adjusted)
State
Initial Claims (this week)
Initial Claims (prior week)
Change
New York
30,166
14,538
15,628
Texas
16,147
14,541
1,606
Kentucky
2,921
2,023
898
Arkansas
1,417
870
547
New Hampshire
896
400
496
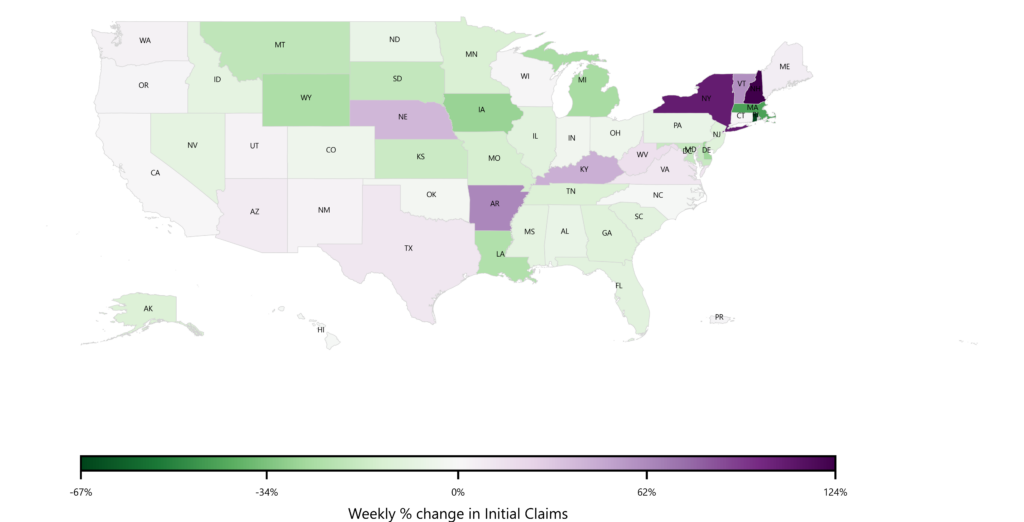
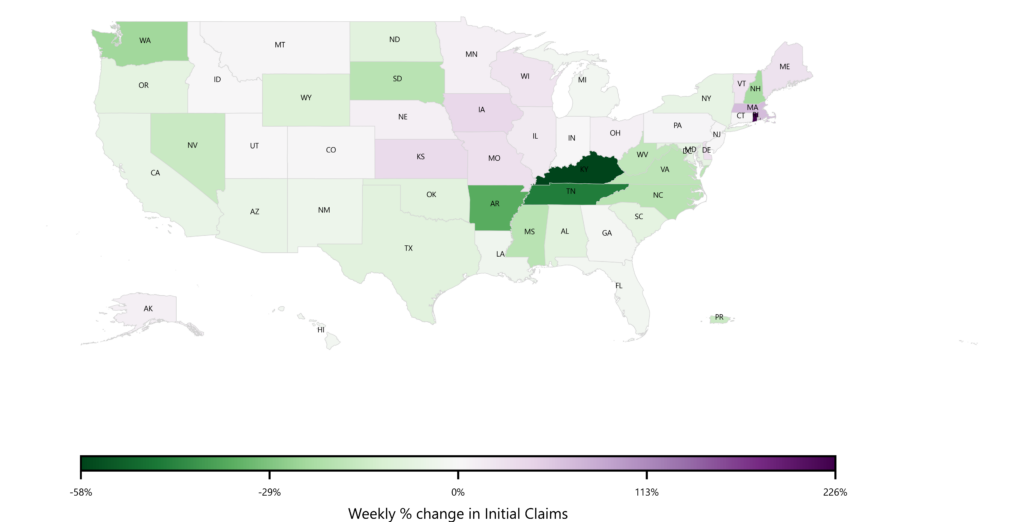
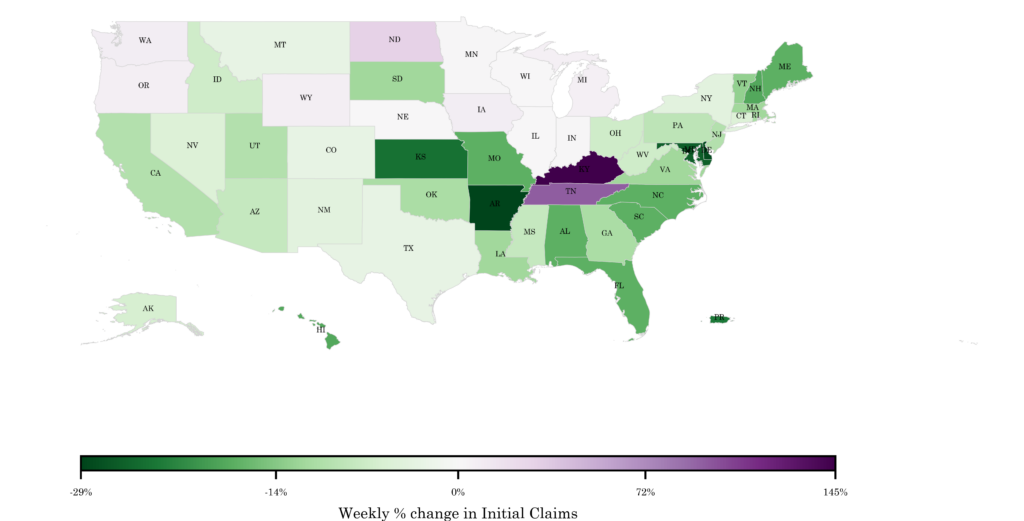
All States Initial Weeks Claimed
An initial claim is a claim filed by an unemployed individual after a separation from an employer. The count of U.S. initial claims for unemployment insurance is a leading economic indicator because it is an indication of emerging labor market conditions in the country. Below is a color-coded map illustrating the percentage change in initial claims from last week to this week across all states nationwide, derived from the latest U.S Department of Labor Weekly Claims News Release (https://www.dol.gov/ui/data.pdf). Green denotes a reduction in continued claims from last week, thus showing improvement, with progressively darker shades of green signifying greater improvement. Purple denotes an increase in continued claims from last week, thus showing deterioration, with progressively darker shades of purple signifying greater deterioration. Very light green, purple or white indicates minimal change from last week. The legend at the bottom provides the color spectrum along with its corresponding percentage value.
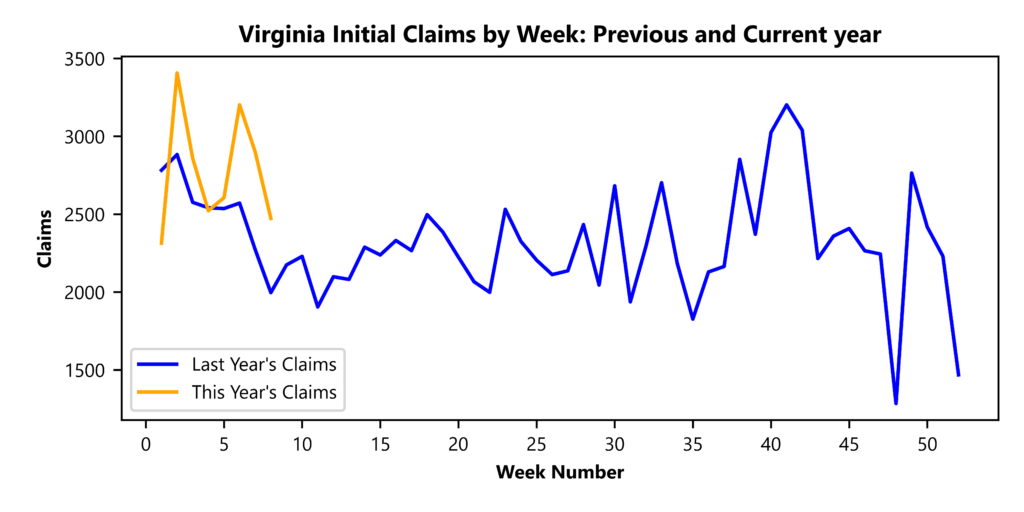
RICHMOND— Virginia Works announced today that 2,473 unemployment insurance weekly initial claims were filed during the week ending February 22, 2025, which is 14.7 percent lower than last week’s 2,899 claims and 23.9 percent higher than the comparable week of last year (1,996). Nearly 70 percent of claimants self-reported an associated industry; of those reported, the top five industries (61 percent) were Professional, Scientific, and Technical Services (362); Health Care and Social Assistance (183); Administrative and Support and Waste Management (179); Retail Trade (178); and Accommodation and Food Services (135).
Continued weeks claims (18,179) were 3.4 percent higher than last week (17,579) and were 15.5 percent higher than the comparable week of last year (15,736). Nearly 91 percent of claimants self-reported an associated industry; of those reported, the top five industries (58 percent) were Professional, Scientific, and Technical Services (2,725); Administrative and Support and Waste Management (2,196); Manufacturing (1,610); Construction (1,596); and Health Care and Social Assistance (1,536).
Significant Layoffs and Announcements are available at the following websites:
Initial Claims – Comparison of Unemployment Insurance Activity
Week Ending02/22/2025
Week Ending02/15/2025
Week Ending02/08/2025
Last Year02/24/2024
Initial Claims
2,473
2,899
3,202
1,996
Initial Change (%)
-426 (-14.7%)
-303 (-9.5%)
+596 (+22.9%)
+477 (+23.9%)
Continued Claims
18,179
17,579
17,288
15,736
Virginia Continued Weeks Claimed
A person who has already filed an initial claim and who has experienced a week of unemployment files a continued claim to claim benefits for that week of unemployment. On a weekly basis, continued claims reflect a good approximation of the current number of insured unemployed workers filing for UI benefits, and are a good indicator of labor market conditions. While continued claims are not a leading indicator, they provide confirming evidence of the direction of the economy. The color-coded map below shows the distribution of this week’s continued claims for Virginia’s counties and cities. Yellow represents low numbers, while progressively darker shades transitioning from yellow to green and dark green signify increasing numbers of continued claims. The legend located at the bottom provides the color spectrum and its corresponding count of continued claims.
Initial Claims for All States
In the week ending February 22, the advance figure for seasonally adjusted initial claims was 242,000, an increase of 22,000 from the previous week’s revised level. The previous week’s level was revised up by 1,000 from 219,000 to 220,000. The advance number of actual initial claims under state programs, unadjusted, totaled 220,541 in the week ending February 22, a decrease of 2,997 (or 1.3 percent) from the previous week. The seasonal factors had expected a decrease of 22,464 (or 10.0 percent) from the previous week. There were 195,774 initial claims in the comparable week in 2024.
Initial State Claims (5 largest decreases) (Not Seasonally Adjusted)
State
Initial Claims (this week)
Initial Claims (prior week)
Change
Kentucky
2,119
5,097
-2,978
Tennessee
3,092
5,658
-2,566
California
42,849
45,015
-2,166
Washington
5,930
7,849
-1,919
Texas
14,407
15,718
-1,311
Initial State Claims (5 largest increases) (Not Seasonally Adjusted)
State
Initial Claims (this week)
Initial Claims (prior week)
Change
Massachusetts
9,179
5,448
3,731
Rhode Island
2,964
909
2,055
Illinois
11,028
9,527
1,501
Wisconsin
5,763
4,671
1,092
Iowa
3,073
2,213
860
All States Initial Weeks Claimed
An initial claim is a claim filed by an unemployed individual after a separation from an employer. The count of U.S. initial claims for unemployment insurance is a leading economic indicator because it is an indication of emerging labor market conditions in the country.
Below is a color-coded map illustrating the percentage change in initial claims from last week to this week across all states nationwide, derived from the latest U.S Department of Labor Weekly Claims News Release (https://www.dol.gov/ui/data.pdf). Green denotes a reduction in continued claims from last week, thus showing improvement, with progressively darker shades of green signifying greater improvement. Purple denotes an increase in continued claims from last week, thus showing deterioration, with progressively darker shades of purple signifying greater deterioration. Very light green, purple or white indicates minimal change from last week. The legend at the bottom provides the color spectrum along with its corresponding percentage value.
RICHMOND— Virginia Works (the Virginia Department of Workforce Development and Advancement) announced today that the U.S. Bureau of Labor Statistics’ December 2024 Job Openings and Labor Turnover Survey (JOLTS) reports steady conditions in Virginia unemployment and job openings.
According to the most recent BLS JOLTS survey data, the number of December 2024 job hires in Virginia increased by 8,000 over the month but were eight percent lower than a year earlier. BLS JOLTS data provides information on all the pieces that go into the net change in the number of jobs. These components include job openings, hires, layoffs, voluntary quits, and other job separations (including retirements and worker deaths). Putting those components together reveals the overall change in payroll employment. JOLTS data is seasonally adjusted and describes conditions on the last business day of the month. Current month’s data are preliminary and the previous month’s data have been revised.
On the last business day in December, there were 253,000 job openings in Virginia, seasonally adjusted, a decrease of 33,000 from November’s revised figure. Nationwide, the number of job openings decreased to 7.6 million (-556,000) on the last business day of December and was down by 1.3 million over the year. The number of job openings decreased in professional and business services (-225,000), health
are and social assistance (-180,000), and finance and insurance (-136,000). Job openings increased in arts, entertainment, and recreation (+65,000). Large increases in the job openings level occurred in California (-117,000), Florida (-73,000), and Colorado (-39,000). In Virginia, the December job openings rate fell to 5.6 percent, a decrease from November’s revised rate. The job openings rate was 4.5 percent in December 2024, decreasing 0.8 percentage point from 5.3 percent a year earlier, in December 2023. Among major industries, job openings rates in December 2024 were 2.5 percent in construction and wholesale trade and 6.4 percent in professional and business services. Nationwide, the largest decreases in job openings rates occurred in Colorado (-1.2 percentage points) and Maryland (-0.8 point), as well as in Florida and Virginia (-0.7 point each).
The number of hires in Virginia rose to 152,000 in December, an increase of 8,000 over the month but down by 13,000 from December 2023. JOLTS defines hires as all additions to the payroll during the month. In December, the number of U.S. hires changed little at 5.5 million but was down by 325,000 over the year. Hires increased in finance and insurance (+48,000). Significant increases in the hires level occurred in Pennsylvania (+32,000) and in Utah (+16,000). In Virginia, the 3.6 hires rate edged up from November’s revised 3.4 percent rate. The U.S. hires rate remained unchanged at 3.4 percent over the month. Large increases in the hires rates occurred in Utah (+0.9 percentage point) and in Pennsylvania (+0.5 point).
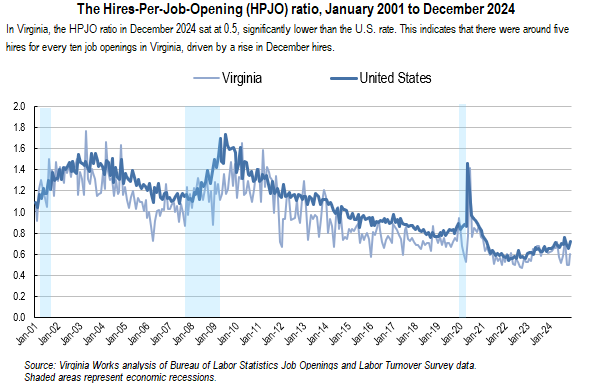
The Virginia hires-per-job-openings (HPJO) ratio was little changed at six hires for every ten job openings, lower than nationwide. This measure shows the rate of hiring compared to open jobs and is a proxy for time to fill positions.
In December 2024, there were 0.5 unemployed per job opening in the Commonwealth, compared to 0.9 unemployed per job opening nationwide. There were 7.6 million job openings in the United States in December 2024, a number not much different than the number of unemployed people, resulting in a ratio of 0.9 unemployed persons per job opening. North Dakota and South Dakota each had 0.4 unemployed persons per job opening and Vermont and Virginia each had 0.5 unemployed persons per job opening. There were 1.3 unemployed persons per job opening in Michigan and Nevada, and 1.7 in California.
Total job separations in Virginia decreased by 3,000 to 139,000. The number of total separations nationwide in December was little changed at 5.3 million. The largest increases occurred in Texas (+127,000), New Jersey (+33,000), and South Carolina (+16,000). The decreases occurred in California (-131,000), Florida (-48,000), and Colorado (-22,000). The Virginia total separations rate was unchanged at 3.3 percent, remaining at levels seen in recent months. The U.S. total separations rate remained unchanged at 3.3 percent over the month. An estimated 91,000 workers quit jobs from Virginia employers in December. The number of quits was little changed from November’s revised figure. This was six percent lower over-the-year and five percent lower than five years earlier. In December, the number of U.S.
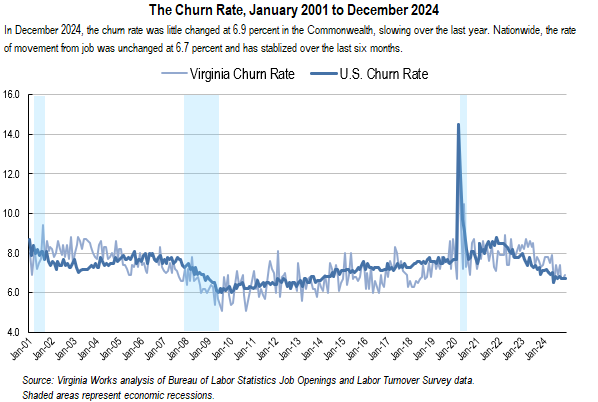
quits was little changed at 3.2 million but declined by 242,000 over the year. Quits decreased in transportation, warehousing, and utilities (-42,000). Large increases occurred in Texas (+105,000) and New York (+28,000). The decreases occurred in Florida (-90,000) and Colorado (-25,000). The quits rate in the Commonwealth was 2.1 percent and remained at levels seen over the last two years. Over the month, the U.S. quits rate was unchanged at 2.0 percent. The December ‘churn’ rate (the sum of the hires rate and total separations rate) in Virginia inched up by 0.2 of a percentage point from November’s revised 6.7 percent figure. This equaled the U.S. churn rate, which was unchanged over the month. While more volatile month-to-month, Virginia’s pace has been more active for over a year.
The number of layoffs and discharges in Virginia was 38,000 in December, a decrease of 2,000 from November’s revised estimate. This was down 12 percent over the year. Layoffs and discharges are countercyclical, which means that layoffs typically increase during economic contractions and decrease during economic expansions. In December, the number of U.S. layoffs and discharges changed little at 1.8 million. Layoffs and discharges increased in transportation, warehousing, and utilities (+87,000), and in mining and logging (+6,000).
The Virginia layoffs and discharges rate was unchanged at nearly one percent in December. The U.S. layoffs and discharges rate remained unchanged at 1.1 percent. For establishments with 5,000 or more employees, the layoffs and discharges rate and total separations rate increased. Large increases in layoffs and discharges rates occurred in Rhode Island (+2.1 percentage points) and New Jersey (+0.6 point).
On the last business day of December, JOLTS data in Virginia and nationwide indicated that job churn often slowed in 2024, with workers more reluctant to leave current positions. At the same time, layoffs remained low, providing a positive labor market signal.
Job Openings
Job openings include all positions that are open on the last business day of the reference month. A job is open only if it meets the following three conditions: (1) A specific position exists and there is work available for that position; the position can be full time or part time, and it can be permanent, short term, or seasonal; (2) the job could start within 30 days, whether or not the employer can find a suitable candidate during that time; and (3) the employer is actively recruiting workers from outside the establishment to fill the position. Excluded are positions open only to internal transfers, promotions or demotions, or recalls from layoffs.
Hires
Hires include all additions to the payroll during the entire reference month, including newly hired and rehired employees; full-time and part-time employees; permanent, short-term, and seasonal employees; employees who were recalled to a job at the location following a layoff (formal suspension from pay status) lasting more than 7 days; on-call or intermittent employees who returned to work after having been formally separated; workers who were hired and separated during the month; and transfers from other locations. Excluded are transfers or promotions within the reporting location, employees returning from a strike, and employees of temporary help agencies, employee leasing companies, outside contractors, or consultants.
Separations
Separations include all separations from the payroll during the entire reference month and are reported by type of separation: quits, layoffs and discharges, and other separations. Quits include employees who left voluntarily, except for retirements or transfers to other locations. Layoffs and discharges include involuntary separations initiated by the employer, including layoffs with no intent to rehire; layoffs (formal suspensions from pay status) lasting or expected to last more than 7 days; discharges resulting from mergers, downsizing, or closings; firings or other discharges for cause; terminations of permanent or short-term employees; and terminations of seasonal employees (whether or not they are expected to return the next season). Other separations include retirements, transfers to other locations, separations due to employee disability, and deaths. Excluded are transfers within the same location, employees on strike, and employees of temporary help agencies, employee leasing companies, outside contractors, or consultants.
Virginia Works plans to release the January 2025 analysis of the BLS Job Openings and Labor Turnover Survey for Virginia on Monday March 24, 2025. The data for all states and the U.S. will be available on the BLS website JOLTS page, at https://www.bls.gov/jlt/. BLS is scheduled to release the January JOLTS data for states on Thursday, March 20, 2025.
### Technical note: Effective with the release of May 2024 data on July 24, 2024, the Job Openings and Labor Turnover Survey (JOLTS) state estimates have been benchmarked and revised to include the annual benchmark revisions to JOLTS national estimates, the Current Employment Statistics (CES) employment estimates, and the Quarterly Census of Employment and Wages (QCEW) data. Seasonally adjusted and not seasonally adjusted data from January 2019 forward are subject to revision. The Bureau of Labor Statistics (BLS) Job Openings and Labor Turnover Survey (JOLTS) produces monthly data on U.S. and regional job openings, hires, quits, layoffs and discharges, and other separations from a sample of approximately 21,000 establishments.
For more information on the program’s concepts and methodology, see “Job Openings and Labor Turnover Survey: Handbook of Methods” (Washington, DC: U.S. Bureau of Labor Statistics, July 13, 2020), https://www.bls.gov/opub/hom/jlt/home.htm. For more information on BLS’ state JOLTS estimates, see https://www.bls.gov/jlt/jlt_statedata.htm. Definitions of JOLTS terms*
RICHMOND — Virginia Works announced today that 2,899 unemployment insurance weekly initialclaims were filed during the week ending February 15, 2025, which is 9.5 percent lower than last week’s 3,202 claims and 27.6 percent higher than the comparable week of last year (2,272). Nearly 74 percent of claimants self-reported an associated industry; of those reported, the top five industries (64 percent) were Manufacturing (400); Professional, Scientific, and Technical Services (378); Administrative and Support and Waste Management (255); Health Care and Social Assistance (181); and Retail Trade (162).
Continued weeks claims (17,579) were 1.7 percent higher than last week (17,288) and were 11.1 percent higher than the comparable week of last year (15,817). Nearly 92 percent of claimants self-reported an associated industry; of those reported, the top five industries (58 percent) were Professional, Scientific, and Technical Services (2,622); Administrative and Support and Waste Management (2,181); Construction (1,592); Health Care and Social Assistance (1,535); and Manufacturing (1,382).
Significant Layoffs and Announcements are available at the following websites:
Initial Claims – Comparison of Unemployment Insurance Activity
Week Ending
02/15/2025
Week Ending
02/08/2025
Week Ending
02/01/2025
Last Year
02/17/2024
Initial Claims
2,899
3,202
2,606
2,272
Initial Change (%)
-303 (-9.5%)
+596 (+22.9%)
+84 (+3.3%)
+627 (+27.6%)
Continued Claims
17,579
17,288
17,201
15,817
Virginia Continued Weeks Claimed
A person who has already filed an initial claim and who has experienced a week of unemployment files a continued claim to claim benefits for that week of unemployment. On a weekly basis, continued claims reflect a good approximation of the current number of insured unemployed workers filing for UI benefits, and are a good indicator of labor market conditions. While continued claims are not a leading indicator, they provide confirming evidence of the direction of the economy.
The color-coded map below shows the distribution of this week’s continued claims for Virginia’s counties and cities.
Yellow represents low numbers, while progressively darker shades transitioning from yellow to green and dark green signify increasing numbers of continued claims. The legend located at the bottom provides the color spectrum and its corresponding count of continued claims.
Initial Claims for All States
In the week ending February 15, the advance figure for seasonally adjusted initial claims was 219,000, an increase of 5,000 from the previous week’s revised level. The previous week’s level was revised up by 1,000 from 213,000 to 214,000. The advance number of actual initial claims under state programs, unadjusted, totaled 222,627 in the week ending February 15, a decrease of 10,118 (or 4.3 percent) from the previous week. The seasonal factors had expected a decrease of 15,416 (or 6.6 percent) from the previous week. There were 199,337 initial claims in the comparable week in 2024.
Initial State Claims (5 largest decreases) (Not Seasonally Adjusted)
State
Initial Claims (this week)
Initial Claims (prior week)
Change
California
45,623
50,545
-4,922
Florida
5,615
6,778
-1,163
Pennsylvania
11,322
12,482
-1,160
New Jersey
9,428
10,442
-1,014
Maryland
2,354
3,175
-821
Initial State Claims (5 largest increases) (Not Seasonally Adjusted)
State
Initial Claims (this week)
Initial Claims (prior week)
Change
Kentucky
5,118
2,085
3,033
Tennessee
5,645
2,892
2,753
Washington
7,768
7,114
654
Michigan
7,734
7,274
460
Oregon
5,585
5,224
361
All States Initial Weeks Claimed
An initial claim is a claim filed by an unemployed individual after a separation from an employer. The count of U.S. initial claims for unemployment insurance is a leading economic indicator because it is an indication of emerging labor market conditions in the country.
Below is a color-coded map illustrating the percentage change in initial claims from last week to this week across all states nationwide, derived from the latest U.S Department of Labor Weekly Claims News Release (https://www.dol.gov/ui/data.pdf). Green denotes a reduction in continued claims from last week, thus showing improvement, with progressively darker shades of green signifying greater improvement. Purple denotes an increase in continued claims from last week, thus showing deterioration, with progressively darker shades of purple signifying greater deterioration. Very light green, purple or white indicates minimal change from last week. The legend at the bottom provides the color spectrum along with its corresponding percentage value.